Microsoft Fabric vs Power BI – Aren’t They Both Microsoft Products? Why would Microsoft create two competing tools? Hold on a second! We’re not questioning your expertise as a CTO, CIO, or decision-maker. You’re more than capable of selecting the best business intelligence tool to fit your data requirements. However, our goal is to guide you toward making an informed choice based on specific use cases, key features, and unique benefits.
Over 25,000 organizations worldwide, including 67% of Fortune 500 companies, are currently leveraging Microsoft Fabric. Additionally, more than 84% of these companies utilize three or more workloads, as stated by Microsoft’s Corporate Vice President. On the other hand, Power BI stands as a top-tier data visualization and reporting tool, boasting over 6 million users. An impressive 97% of Fortune 500 companies rely on it for data insights, according to Gartner.
Feeling even more unsure? Stay with us, just few minutes of reading this blog will give you insights about Microsoft Fabric vs Power BI that usually take hours to find.
What Is Microsoft Fabric?
Microsoft Fabric is an AI-driven, cloud-based SaaS platform that consolidates a wide range of analytical capabilities to meet diverse data requirements within a unified framework. As a relatively new offering, Fabric is one of Microsoft’s most significant data product launches, designed to deliver a modern data architecture emphasizing connectivity, scalability, and an integrated ecosystem.
When comparing Microsoft Fabric and Power BI, Fabric stands out as a comprehensive data analytics platform that seamlessly integrates multiple Microsoft tools, including Data Factory, Data Activator, Synapse Data Warehouse, Synapse Data Engineering, Synapse Data Science, Synapse Real-Time Analytics, and Power BI. This integration enhances data and analytics workflows, covering everything from data integration and engineering to advanced analytics and data science.
Key Microsoft Fabric Features
Microsoft Fabric offers a unified analytics platform designed to simplify data management and accelerate insights. Below are some of its standout features that empower organizations to turn data into actionable intelligence.
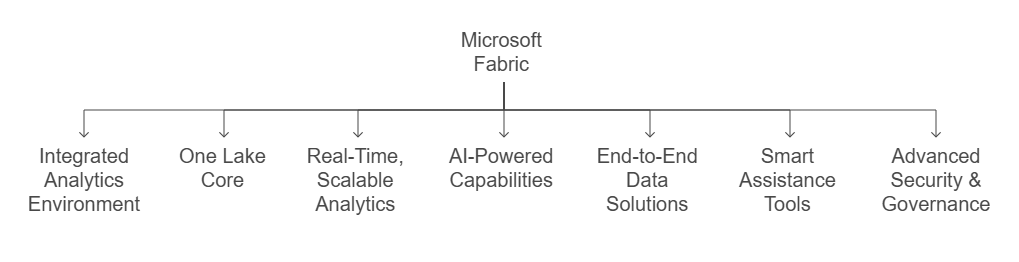
- Integrated Analytics Environment: Unifies business intelligence, data science, and real-time analytics into a single, cohesive platform.
- One Lake Core: Offers a centralized data storage solution, improving data accessibility and simplifying analysis.
- Real-Time, Scalable Analytics: Enables businesses to process and evaluate data instantly as it is generated.
- AI-Powered Capabilities: Incorporates Azure AI to enhance and streamline data operations. Copilot in Microsoft Fabric has been enabled by default for all tenants since May 20th, 2024.
- End-to-End Data Solutions: Seamlessly blends both existing and new Azure features, delivering a comprehensive data ecosystem.
- Smart Assistance Tools: Includes features like GPT-powered Copilot to enhance workflows and support data-driven decisions.
- Advanced Security & Governance: Ensures centralized control over data security and compliance across the entire platform.
What is Power BI?
Power BI is an intuitive, self-service business intelligence platform designed for enterprise use, enabling users to easily gather, analyze, visualize, and report data. With interactive dashboards, it delivers real-time insights, allowing teams to collaborate effectively while maintaining data integrity, security, and consistency.
Think of Power BI as a dynamic data visualization tool that transforms information from sources like Excel, Azure, or SQL Servers into engaging dashboards and reports. It turns complex datasets into meaningful stories that drive decision-making. While Power BI is a part of the Microsoft Fabric ecosystem, it also operates independently as a powerful standalone solution.
Key Power BI Features
Power BI offers a comprehensive analytics platform built to transform data into actionable insights with ease and precision. Below are some of its standout features that help organizations make informed, data-driven decisions.
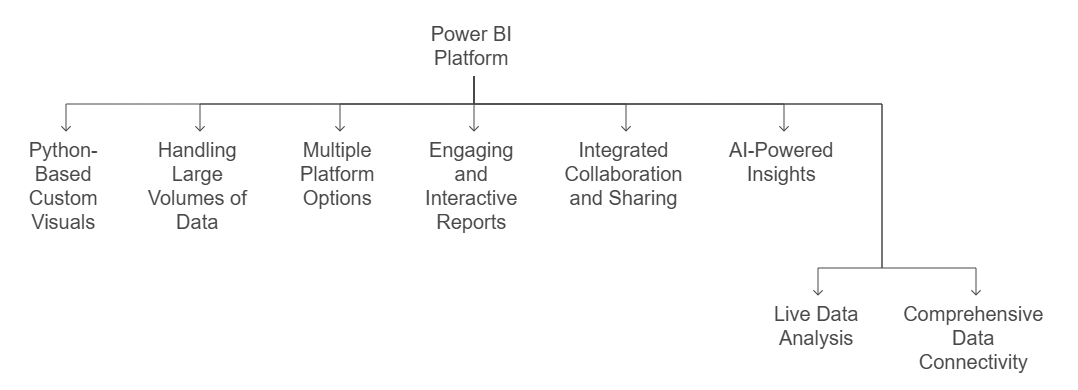
- Python-Based Custom Visuals: Enables the use of Python’s data visualization libraries to create unique, detailed visuals tailored to specific analytical needs.
- Handling Large Volumes of Data: Power BI efficiently processes extensive datasets using advanced compression techniques to simplify and accelerate data insights.
- Multiple Platform Options: Available in various formats such as Power BI Premium, Pro, Desktop, Mobile, and Report Server to meet the diverse requirements of different users and organizations.
- Engaging and Interactive Reports: Supports a rich selection of visual elements such as charts, graphs, and scatter plots, improving both the visual appeal and clarity of reports.
- Integrated Collaboration and Sharing: Seamlessly works with Microsoft tools like SharePoint and Teams to enable smooth data sharing and team-based decision-making.
- AI-Powered Insights: Utilizes built-in artificial intelligence to automate complex analytics tasks, offering features like quick insights and predictive analysis for easier data exploration.
- Live Data Analysis: Capable of processing data in real time, ensuring users always work with the most up-to-date information for timely decisions.
- Comprehensive Data Connectivity: Integrates effortlessly with other Microsoft services, enabling users to combine and analyze data across platforms for deeper, unified insights.
Microsoft Fabric vs Power BI: Key Differences
While Microsoft Fabric and Power BI both deliver powerful data management and analytics features, they are designed to serve different purposes within an organization. The following comparison of Microsoft Fabric vs Power BI outlines how each platform supports various facets of your data strategy.
| Features | Microsoft Fabric | Power BI |
|---|---|---|
| Scope and Functionality | Offers an end-to-end data platform that covers data engineering, data integration, data warehousing, real-time analytics, business intelligence, and AI. | Specializes in data visualization and delivering business intelligence insights. |
| Data Handling and Processing | Equipped with rich features for real-time processing, data pipelines, and large-scale analytics. | Focused mainly on data modeling and transformation to support visual reports. |
| Azure Connectivity | Tightly connected with Azure services, including seamless integration with Azure Synapse Analytics for high-performance processing. | Supports Azure connections through workspaces but not as deeply integrated with advanced Azure services. |
| User Interface and ease of use | Offers a composite workspace and intuitive interface catering to a wide range of roles, from business users to data engineers. | Features an intuitive, drag-and-drop interface mainly focused on business users for easier report creation. |
| Personalization and Adaptability | Extensive flexibility for developers, analysts, and engineers to tailor solutions through scripting, APIs, and integration. | Personalization is limited and mostly focused on dashboard visuals and layouts. |
| Team Collaboration | Built-in features to enable seamless collaboration and teamwork across various teams. | Primarily supports collaboration through the Power BI service and shared workspaces. |
| AI and Advanced Analytics | Designed to enhance AI-driven data analysis and integrates deeply with Azure Machine Learning and other AI tools. | Primarily supports collaboration through the service. |
| Pricing Model | Roles, including engineers, data scientists, and business users, are factored in. Charges are determined by capacity units, data consumption, and services enabled by Fabric. | Charges if reports and dashboards are shared; Power BI is user-specific pricing under Pro, Premium, or Embedded Intelligence features. |
Microsoft Fabric and Power BI: Business Use Cases
While both Microsoft Fabric and Power BI are powerful data tools, each is best suited for different business scenarios. Let’s explore where they prove most effective in Microsoft Fabric vs Power BI.
Microsoft Fabric Use Cases
- Centralized Enterprise Data Management
Enterprises dealing with diverse data sources across various departments can leverage Microsoft Fabric to build a unified data environment. This supports smooth integration, processing, and analysis of large-scale data while ensuring consistent governance. - Real Time Data Driven Insights
Businesses that rely on real time data such as from IoT sensors or live customer behavior can utilize Fabric’s real time analytics to gain instant insights, enabling quick and informed decision making based on up to the minute trends. - Enhanced AI and Machine Learning Integration
Companies aiming to implement predictive analytics and machine learning models choose Microsoft Fabric for its built-in data science tools. It streamlines the entire process of developing, training, and deploying AI models within a unified platform. - Scalable Data Engineering Across Platforms
Organizations handling complex ETL workflows and varied data processing tasks benefit from Fabric’s robust data engineering features. It enables them to design and manage advanced data pipelines that operate seamlessly across multiple systems.
Power BI Use Cases
- Team-Level Reporting
Departments that require frequent reports and performance dashboards can rely on Power BI to design and distribute interactive visuals. It helps teams gain rapid insights into key metrics relevant to their specific functions.
- User-Driven Analytics
In organizations where non-technical users need the ability to generate custom reports and analyze data on their own, Power BI stands out with its easy-to-use interface and powerful data exploration tools. - Financial Reporting and Insights
Finance departments turn to Power BI for its robust calculation features and rich visualizations, making it ideal for building in-depth financial reports, budget reviews, and forecast dashboards. - Sales and Marketing Analytics
Sales and marketing professionals use Power BI to monitor key performance indicators, understand customer trends, and develop visually engaging reports for stakeholders, all with easily refreshable dashboards. - Executive-Level Dashboards
Executives and senior managers rely on Power BI to access high-level dashboards that offer a snapshot of core business metrics, along with the flexibility to drill down into detailed data for deeper insights.
Conclusion
Deciding whether to use Microsoft Fabric or Power BI largely comes down to your organization’s specific requirements. Microsoft Fabric is a powerful solution for end-to-end data management, making it well-suited for businesses dealing with large-scale and complex data operations. In contrast, Power BI focuses on delivering strong data visualization and business intelligence features, offering an intuitive platform for building interactive dashboards and insightful reports.
If you’re still unsure which solution fits your needs best, reach out to us and our team at intelegain. We will guide you through the right strategy and implementation.

Frequently Asked Questions
Microsoft Fabric is geared toward comprehensive data handling, including integration, processing, and governance. In contrast, Power BI is primarily focused on visualizing data and enabling users to generate business insights through interactive dashboards and reports.
Absolutely. Microsoft Fabric handles data integration and processing, while Power BI transforms that data into interactive reports and visual insights.
Microsoft is combining Power BI with Fabric to offer a unified platform that brings together data integration, processing, and visualization in one comprehensive solution for businesses.
Yes, Microsoft Fabric supports real-time data handling, making it a great choice for businesses that need timely and continuously updated insights.